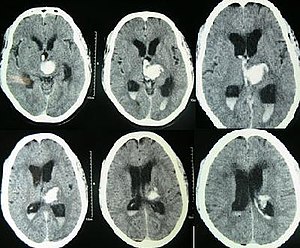
Sometime between a week to two weeks you will hear that an ultrasound of your baby’s brain has been ordered. What the team is looking for here is bleeding eithre within the fluid filled chambers of the ventricles (appear black in the picture below with blood that shows up as white). This early ultrasound is meant to pick up this type of injury while one done a few weeks later attempts to pick something else up.
Bleeding occurs due to the fragile naure of the brain tissue when born preterm. The more preterm an infant is the greater the risk of a signficant amount of bleeding. Bleeding tends to occur from an area of the brain just under the lining of the fluid filled ventricles that has a very rich blood supply. Anything that causes fluctuations in blood flow to this area of the brain can lead to injury and bleeding from this site. Blood in the ventricles of the brain is referred to as an Intraventricular hemorrhage or IVH for short.
Classically you will hear the team discuss the results of your baby’s head ultrasounds as having one of five possible categories.
No IVH
Grade 1 IVH – blood just under the lining of the ventricle
Grade 2 IVH – blood has gotten into the ventricle but is not causing it to get signiicantly enlarged
Grade 3 IVH – blood has entered the ventricle and is causing the chamber to grow as fluid that normally drains out is getting blocked by blood from leaving. As fluid (cerebral spinal fluid) continues to be produced, if it has trouble draining out it is like a kitchen sink with the tap turned on and something blocking the drain)
Grade 4 IVH – this is actually a bit different and is blood within the tissues of the brain outside of the ventricles. This is caused by blood flow in the veins of the brain being too slow and then causing vessels to rupture from lack of flow and oxygen.
A grade 3 IVH is shown below with the chambers swelling (black).
What can happen if the bleeding is significant?
It is the Grade 3 and 4 bleeds that we really worry about. The grade 1 bleeds tend to resolve on their own. When we see a bleed you can expect to see a new ultrasound be done in 1-2 weeks to folllow up and make sure it doesn’t get worse. If a grade 3 bleed continues to cause the ventricles to increase in size we worry with time that this may put pressure on the brain and affect the amount of blood flow the brain receives. If this is happening you may hear that we are asking Neurosurgery to see your infant. They will work with us to determine whether your baby needs a drain put into the ventricle to help get rid of the excess fluid. Many times the ventricles as we watch them with additional ultrasounds get smaller with time but some do not and will need this plastic drain put in to allow the brain to have this pressure relieved.
With the Grade 4 bleeds with time the body will absorb this damaged tissue and your baby may be left with a hole in the brain where the injured tissue was. While this sounds frightening the ability of our ultrasounds to predict eventual outcome is not great. Such infants though will generally be followed in a high risk follow up clinic and carefully monitored for their development. If they are found to have any deficits, depending on your location a variety of services may be offered to help optimize the best chance for a good outcome. Such services might include involvement of an occupational therapist or physiotherapist.
Late Ultrasounds
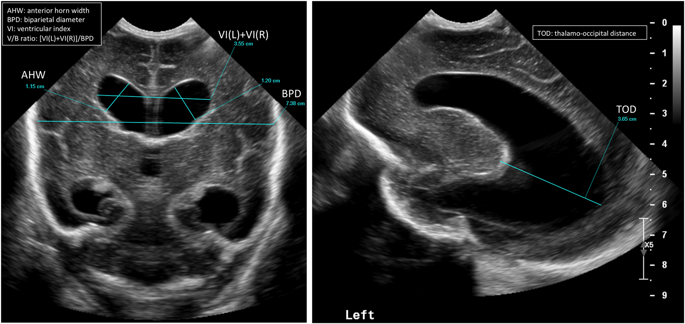
Sometime between about 4-6 weeks after birth or in some cases near discharge another ultrasound will be done. This time the team is looking for something different. The risk of fresh bleeding has passed but now we are looking for evidene of a lack of blood supply at some point from the arteries that provide blood supply to the brain. Many weeks after being born if there has been a period of significant impairment of blood flow to the brain we may see evidence of this. The brain has both white and gray matter (tissue). The gray matter is all along the surface of the brain. Underneath though and right next to the ventricles is the white mattter. This white matter is where the injury we are looking for may have occurrred. We call this injury periventricular leukomalacia. This means injury to the white matter. The white matter is where our neurological tissue for motor function travels so in these infants with such injury there can be problems with normal movement in the legs usually, moreso than the arms. Assessments in babies with such injury may find increases in the muscle tone in the NICU. In such cases, referral to a physiotherapist early to teach families how to do stretching exercises as an example will be done. Similarly, positioning devices from an occupational therapist may also be recommended.
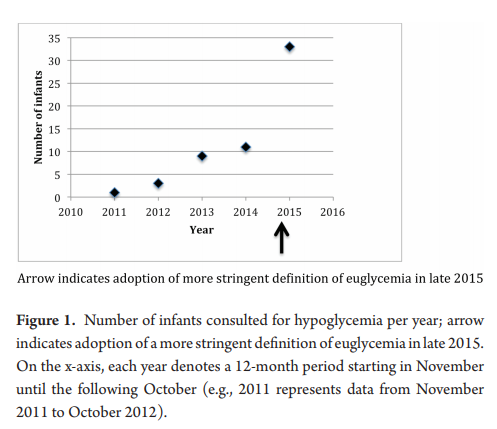
In 2015 the Pediatric Endocrine Society (PES) published new recommendations for defining and managing hypoglycaemia in the newborn. A colleague of mine and I discussed the changes and came to the conclusion that the changes suggested were reasonable with some “tweaks”. The PES suggested a change from 2.6 mmol/L (47 mg/dL) at 48 hours of age as a minimum goal glucose to 3.3 mmol/L (60 mg/dL) as the big change in approach. The arguments for this change was largely based on data from normal preterm and term infants achieving the higher levels by 48-72 hours and some neuroendocrine data suggesting physiologically, the body would respond with counter regulatory hormones below 3.3 mmol/L.
As it turned out, we were “early adopters” as we learned in the coming year that no other centre in Canada had paid much attention to the recommendations. The inertia to change was likely centred around a few main arguments.
1. How compelling was the data really that a target of 2.6 and above was a bad idea?
2. Fear! Would using a higher threshold result in many “well newborns” being admitted to NICU for treatment when they were really just experiencing a prolonged period of transitional hypoglycaemia.
3. If its not broken don’t fix it. In other word, people were resistant to change itself after everyone was finally accustomed to algorithms for treatment of hypoglcyemia in their own centres.
What effect did it actually have?
My colleagues along with one of our residents decided to do a before and after retrospective comparison to answer a few questions since we embraced this change. Their answers to what effect the change brought about are interesting and therefore at least a in my opinion worth sharing. If any of you are wondering what effect such change might have in your centre then read on!
Once the protocol was in place we went from arbitrary consults to mandatory so these results are not surprising. What is surprising though is that the median critical plasma glucose was 2.2 mmol/L, with no significant difference pre or post (2.0 mmol/L pre versus 2.6 mmol/L post, P=0.4) Ninety percent of the infants who were hypoglycemic beyond 72 hours of age were so in the first 72 hours. Of these infants, 90% were diagnosed with hyperinsulinemia. What this tells us is that those who are going to go on to have persistent hypoglycemia will demonstrate similar blood sugars whether you use the cutoff of 2.6 or 3.3 mmol/L. You will just catch more that present a little later using the higher thresholds. How would these kids do at home if discharged with true hyperinsulinemia that wasn’t treated? I can only speculate but that can’t be good for the brain…
Now comes the really interesting part!
Of the total infants in the study, thirteen infants or 40% had plasma glucose values of 2.6 to 3.2 mmol/L at the time of consultation after November 2015. Think about that for a moment. None of these infants would have been identified using the old protocol. Nine of these infants went on to require treatment with diazoxide for persistent hyperinsulinemia. All of these infants would have been missed using the old protocol. You might ask at this point “what about the admission rate?”. Curiously an internal audit of our admission rates for hypoglycemia during this period identified a decline in our admission rates. Concurrent with this change we also rolled out the use of dextrose gels so the reduction may have been due to that as one would have expected admission rates to rise otherwise. The other thing you might ask is whether in the end we did the right thing as who says that a plasma blood glucose threshold of 3.3 mmol/L is better than using the tried and true 2.6 mmol/L cutoff?
While I don’t have a definitive answer to give you to that last question, I can leave you with something provocative to chew on. In the sugar babies study the goal glucose threshold for the first 7 days of life was 2.6 mmol/L. This cohort has been followed up and I have written about these studies before in Dextrose gel for hypoglycemia. Safe in the long run? One of the curious findings in this study was in the following table.
Although the majority of the babies in the study had only mild neurosensory impairment detectable using sophisticated testing the question is why should so many have had anything at all? I have often wondered whether the goal of keeping the blood sugar above 2.6 mmol/L as opposed to a higher level of say 3.3 mmol/L may be at play. Time will tell if we begin to see centres adopt the higher thresholds and then follow these children up. I don’t know about you but a child with a blood sugar of 2.7 mmol/L at 5 or 6 days of age would raise my eyebrow. These levels that we have used for some time seem to make sense in the first few days but for discharge something higher seems sensible.
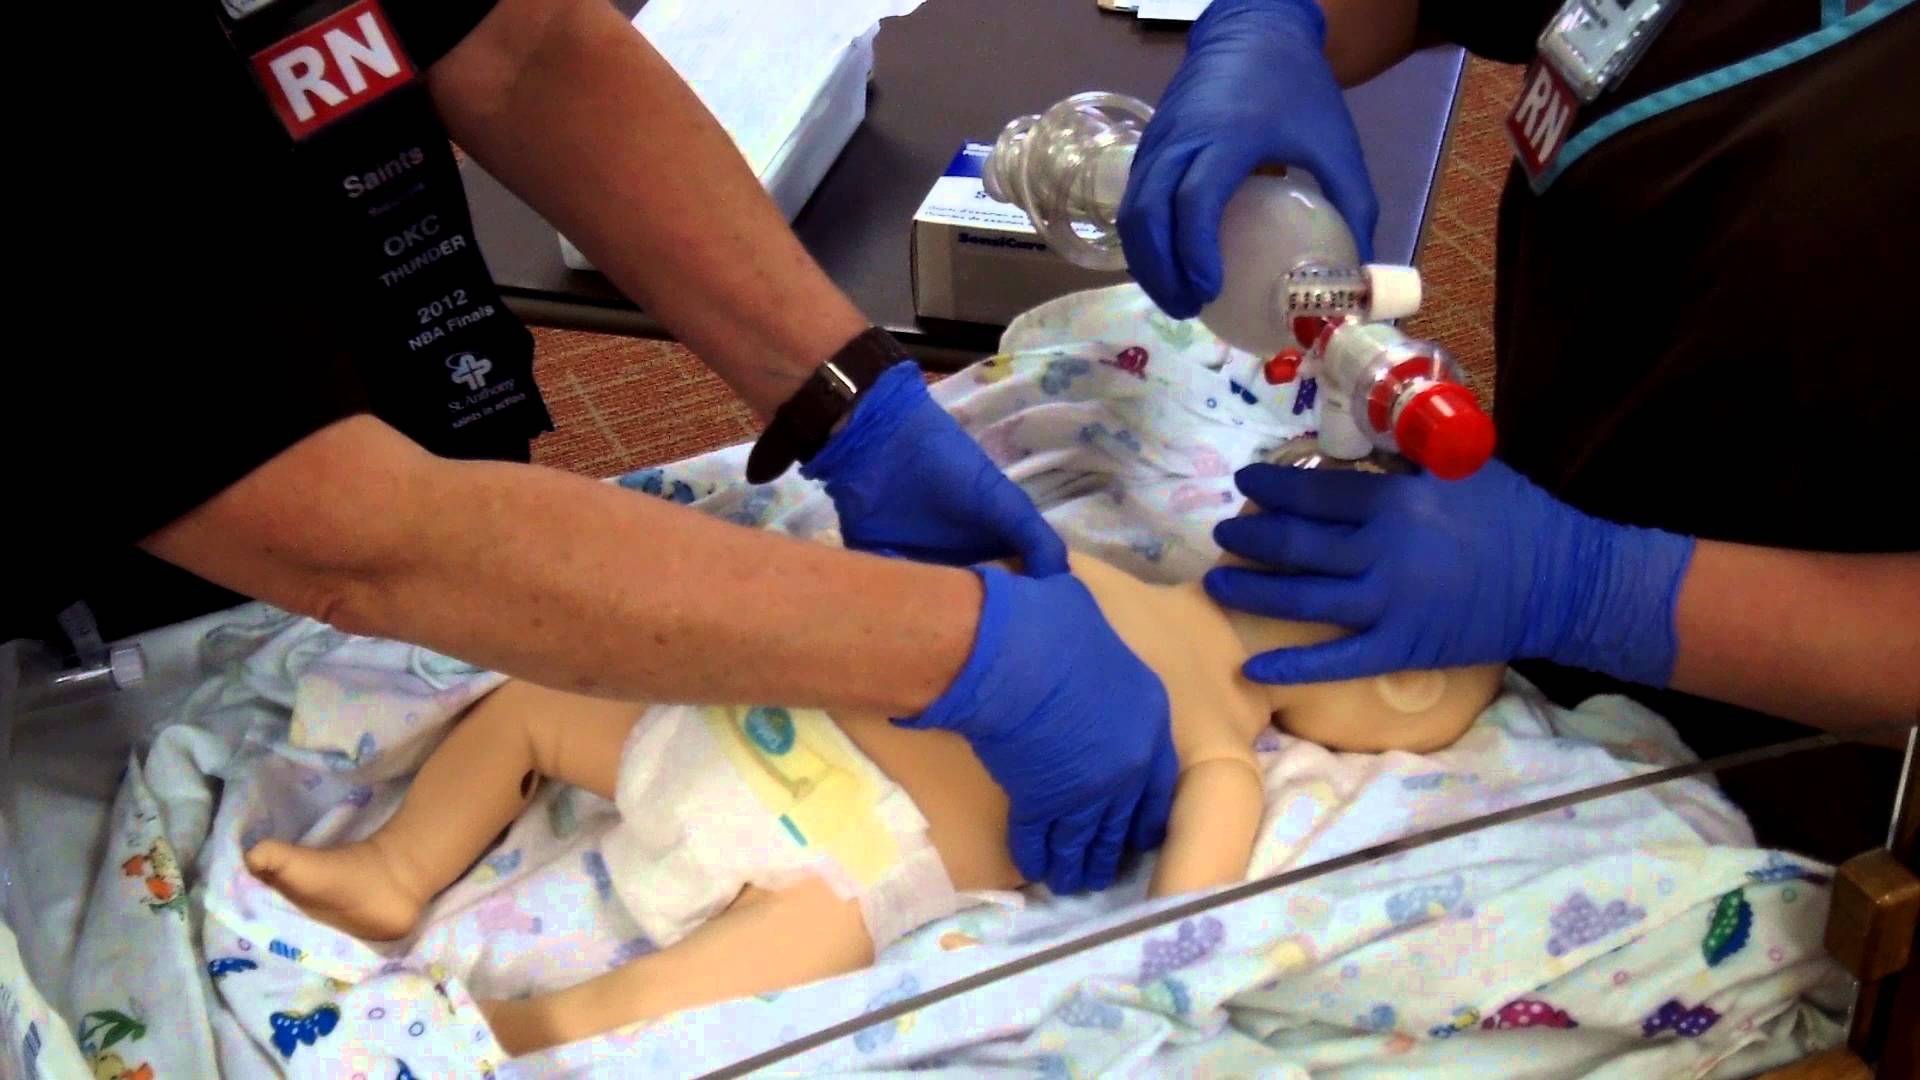
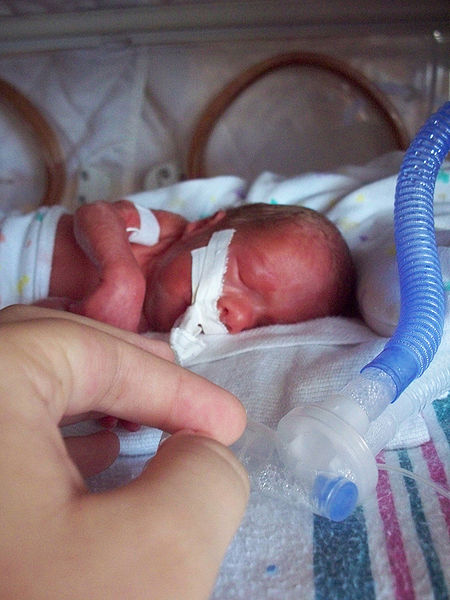
Look around an NICU and you will see many infants living in incubators. All will eventually graduate to a bassinet or crib but the question always is when should that happen? The decision is usually left to nursing but I find myself often asking if a baby can be taken out. My motivation is fairly simple. Parents can more easily see and interact with their baby when they are out of the incubator. Removing the sense of “don’t touch” that exists for babies in the incubators might have the psychological benefit of encouraging more breastfeeding and kangaroo care. Both good things.
Making the leap
For ELBW and VLBW infants humidity is required then of course they need this climate controlled environment. Typically once this is no longer needed units will generally try infants out of the incubator when the temperature in the “house” is reduced to 28 degrees. Still though, it is not uncommon to hear that an infant is “too small”. Where is the threshold though that defines being too small? Past research studies have looked at two points of 1600 vs 1800g for the smallest of infants. One of these studies was a Cochrane review by New K, Flenady V, Davies MW. Transfer of preterm infants for incubator to open cot at lower versus higher body weight. Cochrane Database Syst Rev 2011;(9). This concluded that early transition was safe for former ELBWs at the 1600g weight cut off.
What about the majority of our babies?
While the ELBW group takes up a considerable amount of energy and resources the later preterm infants from 29 to 33 6/7 weeks are a much larger group of babies. How safe is this transition for this group at these weights? Shankaran et al from the NICHD published an RCT on this topic recently; Weaning of Moderately Preterm Infants from the Incubator to the Crib: A Randomized Clinical Trial. The study enrolled
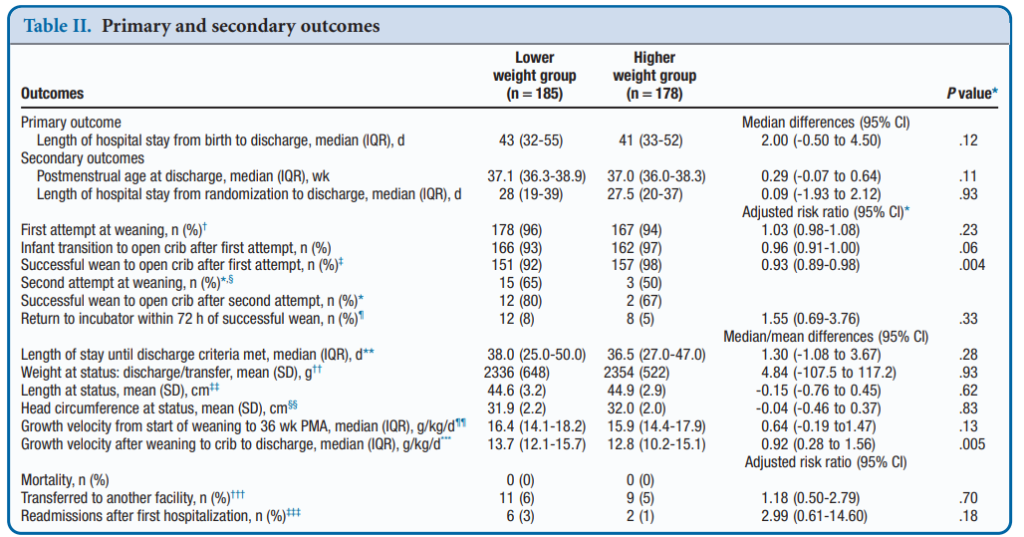
Infants in this gestational age range with a birth weight <1600g were randomly assigned to a weaning weight of 1600 or 1800 g. Within 60 to 100 g of weaning weight, the incubator temperature was decreased by 1.0°C to 1.5°C every 24 hours until 28.0°C. Weaning to the crib occurred when axillary temperatures were maintained 36.5°C to 37.4°C for 8 to 12 hours. Clothing and bedcoverings were standardized. The primary outcome was LOS from birth to discharge.
What did they find?
A total of 366 babies were enrolled (187 at 1600g and 179 at 1800g. Baseline characteristics of the two groups revealed no statistical differences. Mean LOPS was a median of 43 days in the lower and 41 days in the higher weight group (P = .12). After transition to a crib weight gain was better in the lower weight group, 13.7 g/kg/day vs 12.8 g/kg/ day (P = .005). Tracking of adverse events such as the incidence of severe hypothermia did not differ between groups. The only real significant difference was a better likelihood of weaning from the incubator in the higher group at 98% success vs 92% on the first attempt. Putting. That in perspective though, a 92% success rate by my standards is high enough to make an attempt worthwhile!
Concluding thoughts
The authors have essentially shown that whether you wean at the higher or lower weight threshold your chances of success are pretty much the same. Curiously, weight gain after weaning was improved which seems counter intuitive. I would have thought that these infants would have to work extra hard metabolically to maintain their temperature and have a lower weight gain but that was not the case. Interestingly, this finding has been shown in another study as well; New K, Flint A, Bogossian F, East C, Davies MW. Transferring preterm infants from incubators to open cots at 1600 g: a multicentre randomised controlled trial. Arch Dis Child Fetal Neonatal Ed 2012;97:F88-92. Metabolic rate has been shown to increase in these infants but skin fold thickness has been shown to increase as well in infants moved to a crib. How these two things go together is a little beyond me as I would have thought that as metabolic rate increases storage of tissue would slow. Not apparently the case but perhaps just another example of the bodies ability to overcome challenges when put in difficult situations. A case maybe of “what doesn’t kill you makes you stronger?”
The authors do point out that the intervention was unmasked but the standardization of weaning procedure and garments used in the cribs should have overcome that. There were 36% of parents who did not consent to the study so their inclusion could have swayed the results perhaps but the sample size here was large despite that. That the final results agree with findings in ELBW infants suggests that the results are plausible.
What I think this study does though is tell us overall that weaning at a smaller weight is at least alright to try once one is at minimal settings in an incubator. Will this change your units practice? It is something that at least merits discussion.
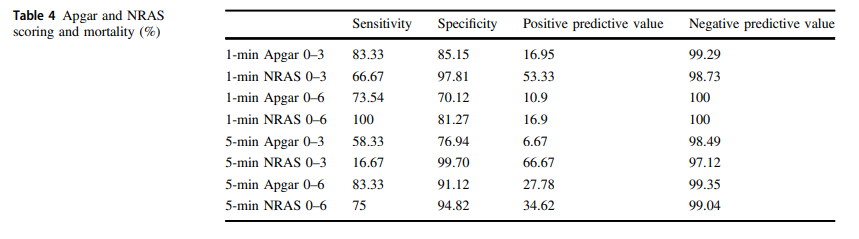
One of the first things a student of any discipline caring for newborns is how to calculate the apgar score at birth. Over 60 years ago Virginia Apgar created this score as a means of giving care providers a consistent snapshot of what an infant was like in the first minute then fifth and if needed 10, 15 and so on if resuscitation was ongoing. For sure it has served a useful purpose as an apgar score of 0 and 0 gives one cause for real worry. What about a baby with an apgar of 3 and 7 or 4 and 8? There are certainly infants who have done very well who initially had low apgar scores and conversely those who had higher apgar scores who have had very significant deleterious outcomes including death. I don’t mean to suggest that the apgar scores don’t provide any useful predictive value as they are used as part of the criteria to determine if a baby merits whole body cooling or not. The question is though after 60+ years, has another score been created to provide similar information but enhance the predictive value derived from a score?
The Neonatal Resuscitation and Adaptation Score (NRAS)
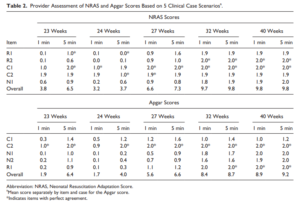
Back in 2015 Jurdi et al published Evaluation of a Comprehensive Delivery Room Neonatal Resuscitation and Adaptation Score (NRAS) Compared to the Apgar Score. This new score added into a ten point score resuscitative actions taken at the 1 and 5 minute time points to create a more functional score that included interventions. The other thing this new score addressed was more recent data that indicated a blue baby at birth is normal (which is why we have eliminated asking the question “is the baby pink?” in NRP. Knowing that, the colour of the baby in the apgar score may not really be that relevant. Take for example a baby with an apgar score of 3 at one minute who could have a HR over 100 and be limp, blue and with shallow breathing. Such a baby might get a few positive pressure breaths and then within 10 seconds be breathing quite well and crying. Conversely, they might be getting ongoing PPV for several minutes and need oxygen. Were they also getting chest compressions? If I only told you the apgar score you wouldn’t have much to go on. Now look at the NRAS and compare the information gathered using two cardiovascular (C1&2), one neurological test (N1) and two respiratory assessments (R1&2).
The authors in this study performed a pilot study on only on 17 patients really as a proof of concept that the score could be taught and implemented. Providers reported both scores and found “superior interrater reliability (P < .001) and respiratory component reliability (P < .001) for all gestational ages compared to the Apgar score.”
A Bigger Study Was Needed
The same group in 2018 this time led by Witcher published Neonatal Resuscitation and Adaptation Score vs Apgar: newborn assessment and predictive ability. The primary outcome was the ability of a low score to predict mortality with a study design that was a non-inferiority trial. All attended deliveries were meant to have both scores done but due to limited numbers of trained personnel who could appropriately administer both scores just under 90% of the total deliveries were assigned scores for comparison. The authors sought to recruit 450 infants to show that a low NRAS score (0–3) would not be inferior to a similar Apgar at predicting death. Interestingly an interim analysis found the NRAS to be superior to Apgar when 75.5% of the 450 were enrolled, so the study was stopped. What led the apgar score to perform poorly in predicting mortality (there were only 12 deaths though in the cohort) was the fact that 49 patients with a 1 minute apgar score of 0-3 survived compared to only 7 infants with a low NRAS score.
The other interesting finding was the ability of the NRAS to predict the need for respiratory support at 48 hours with a one minute apgar score of 0-3 being found in 39% of those on support compared to 100% of those with a low NRAS. Also at 5 minutes a score of 4-6 for the apgar was found in 48% of those with respiratory support at 48 hours vs 87% of those with a similar range NRAS. These findings were statistically significant while a host of other conditions such as sepsis, hypoglycemia, hypothermia and others were no different in terms of predictive ability of the scores.
An Even Bigger Study is Needed
To be sure, this study is still small and missed just over 90% of all deliveries so it is possible there is some bias that is not being detected here. I do think there is something here though which a bigger study that has an army of people equipped to provide the scoring will add to this ongoing story. Every practitioner who resuscitates an infant is asked at some point in those first minutes to hour “will my baby be ok?”. The truth is that the apgar score has never lived up to the hope that it would help us provide an accurate clairvoyant picture of what lies ahead for an infant. Where this score gives me hope is that a score which would at the very least help me predict whether an infant would likely still be needing respiratory support in 48 hours provides the basic answer to the most common question we get in the unit once admitted; “when can I take my baby home”. Using this score I could respond with some greater confidence in saying “I think your infant will be on support for at least 48 hours”. The bigger question though which thankfully we don’t have to address too often for the sickest babies at birth is “will my baby survive?”. If a larger study demonstrates this score to provide a greater degree of accuracy then the “Tipping Point” might just be that to switching over to the NRAS and leaving the apgar score behind. That will never happen overnight but medicine is always evolving and with time you the reader may find yourself becoming very familiar with this score!
It has been a few months now that I have been serving as Chair of the Fetus and Newborn Committee for the Canadian Pediatric Society. Certain statements that we release resonate strongly with me and the one just released this week is certainly one of them. Guidelines for vitamin K prophylaxis in newborns is an important statement about a condition that thankfully so few people ever experience. To read the statement on the CPS website click here.
Similar story to vaccinations
Prior to the American Academy of Pediatrics in 1961 proclaiming that all newborns should receive IM Vitamin K at birth the incidence of Vitamin K deficient bleeding was 0.25 – 1.7%. Think about that for a moment. A new parent could expect that 1/100 babies roughly might have intestinal bleeding or worse an intracranial hemorrhage due to an insufficient amount of vitamin K levels in the newborn. The types of bleeding could be categorized into three different time epochs. Early onset (occurring in the first 24 hours post-birth), classic (occurring at days 2 to 7) and late onset (at 2 to 12 weeks and up to 6 months of age).
With a rate that high detractors of providing Vitamin K at birth would say “why should we give it; I haven’t heard of any baby getting such bleeding?” Looking at it another way though, why don’t you see congenital rubella or kids with measles much these days? It’s due to vaccination. Thankfully as a Neonatologist, I don’t see Vitamin K deficient bleeding since most parents provide Vitamin K to their babies at birth. If you went back to the era prior to 1961 when widespread supplementation of Vitamin K began in the US, I imagine it would not have been too uncommon to hear about a baby who had bleeding issues after birth. Just because we don’t hear about German Measles much anymore doesn’t mean the virus causing it doesn’t still exist!
How Effective is Vitamin K?
How effective is Vitamin K administration at birth in preventing hemorrhagic disease of the newborn (HDNB)? Studies estimate an incidence of 0.25 per 100000 live births or 1 in 400000 babies vs the 1/100 risk without any vitamin K. That is one effective intervention! At this point I would ask those families that are still concerned about giving Vitamin K to their infants if this is a risk they can accept? If they refuse Vitamin K and there is a significant bleed how will they react?
The Change in this CPS Statement From the Past
In the last statement on Vitamin K, the authors suggested that the oral route was a reasonable option. Instead of giving 1 mg of Vitamin K IM one would dose it as 2 mg orally and then repeat at 2-4 weeks and then 6-8 weeks. In looking at the effectiveness though it is worth noting that while we can assure that families will get the first dose, as with any medication that needs repeat dosing there is the risk of forgetfulness leading to missed dosing down the road. In fact when the authors looked at the risk of late HDNB they found the following “The relative risk for VKDB, when comparing PO versus IM vitamin K administration in these two studies, was 28.75 (95% CI 1.64 to 503.45) and 5.97 (95% CI 0.54 to 65.82), respectively [19][20].”
The outcome of course remains rare but the risk based on two studies was almost 30 times higher than if IM dosing was given.
On this basis IM is recommended.
Having said all this I recognize that despite all this information, some families will choose for a number of reasons to still opt for the oral dose. As the statement suggests we need to encourage such use when a family refuses IM vitamin K. The 30 fold risk compared to IM administration is magnitudes lower than the approximate 1/100 risk of giving nothing at all!
In the end I believe that one case of intracranial hemorrhage from inadequate vitamin K is too much. This one vitamin indeed could save a life.
 Not surprisingly as the graph demonstrates the number went up.